How to use Indices to Maximize Returns
Token Metrics Updated Indices Tutorial | Newly Added Feature of Token Metrics
The Token Metrics Indices are one of the most popular features on our site.
These indices give users model portfolios built by artificial intelligence, catered to their preferred exchange, time horizon, and risk tolerance!
Let’s break down the indices page, section by section, so you can better understand the information it contains.
Index Selection Panel

Despite all the data contained within the indices page, the index selection box is actually the only section that requires any user actions.
The index selection is where you select the index that best fits your investing style.
You can choose your time horizon and your preferred exchange, or all exchanges if you use more than one.
If your risk tolerance is higher, you can also select our Low Cap indices, which exclusively contains coins that have market caps of $30 million or less. (To ensure projects have significant liquidity, we only allow coins with a 24-hour trading volume of $300,000 or more.)
We recommend investing as close to the rebalancing as possible because this is when our data is the most up-to-date and relevant.
Index Allocation

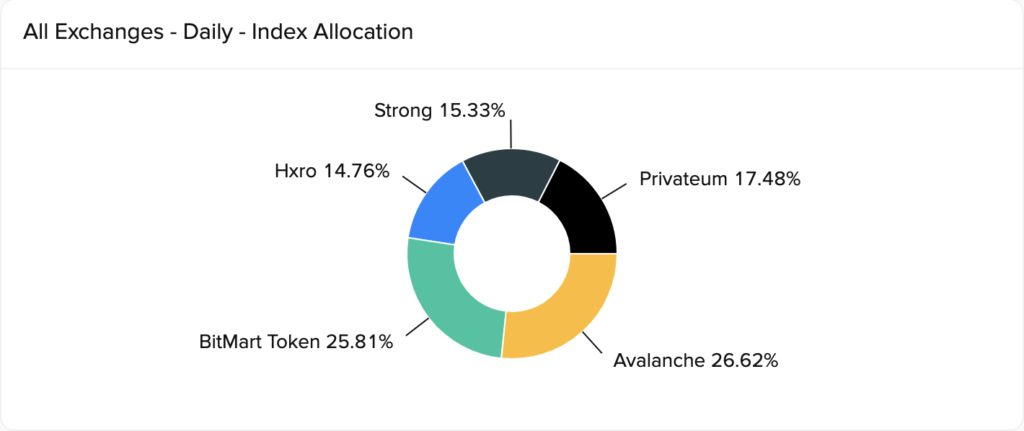
The index allocation portion of the indices page is where we first get the chance to see the portfolio built by our models.
The pie chart conveniently shows the allocation of each asset as a percentage, so you can easily invest no matter the principal you’re starting with.
For example, if you’re investing $5,000 in the index above and you want to know how much Avalanche to buy, simply multiply 5,000 * .2662 and you get that you should purchase $1,331 worth of AVAX.
Performance Chart

Next up is the index performance chart, which tracks the performance of our indices versus Bitcoin. To zoom out and look at a larger timer period, click on one of the time options in the top right.
You also have the option to view the ROI of the Indices for each day by selecting “Daily Return Performance” or viewing the portfolio’s risk statistics by selecting “Table of Statistics”.
Index Holdings

The index holdings table gives us a more detailed view of the performance of the individual coins held within the portfolio.
This includes information like the ROI of the coin since the AI purchased it, the initial purchase price, the current price, and the cash value of the token.
One important thing to note here is that each index started with $10,000 when they were launched on July 1.
Last Index Transactions

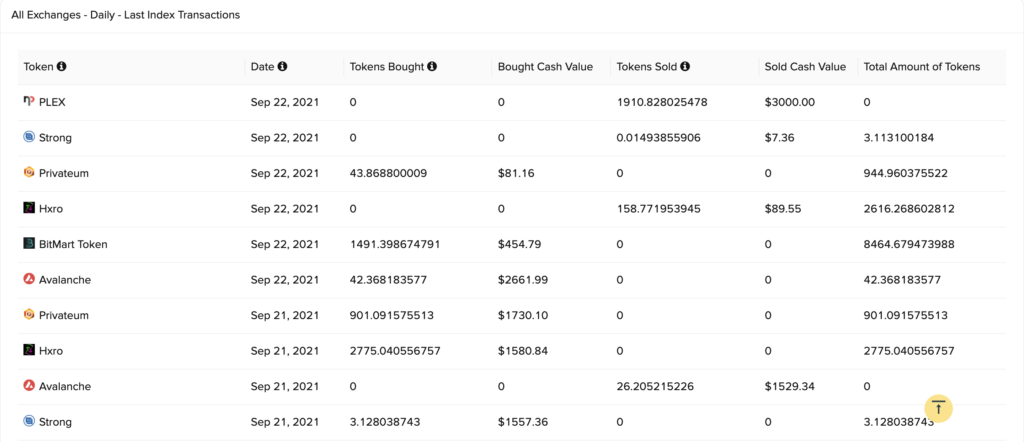
The last index transactions table shows us the coins that were held in previous rebalances of the indices.
This will tell users the date, cash value, and the number of tokens purchased in one row.
In a separate entry in the table, we will see the selling of the tokens assuming they were not kept in the index for the next rebalance.
The tokens currently in the index will only have a purchase entry, there will only be a sell if they have previously been in the index.


