BTC & ETH Road map, July – October 2022 | Market Navigator
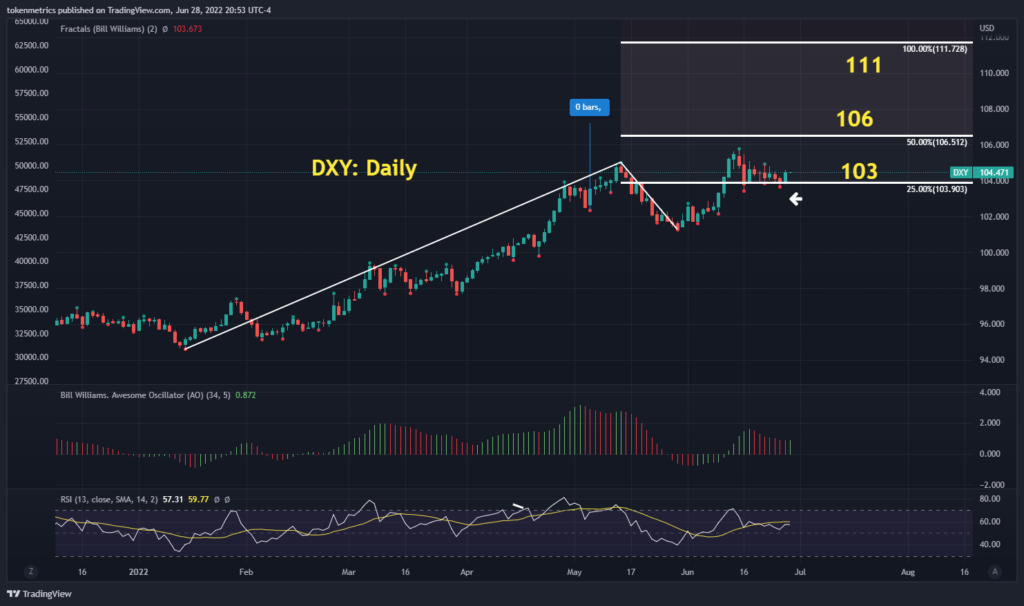
Dollar Index Daily

Past performance not indicative of future returns
The Dollar Index (DXY) bounced off a major hidden pivot level at 103. This could mean the Dollar could move much higher. That, in turn, could make crypto go much lower.
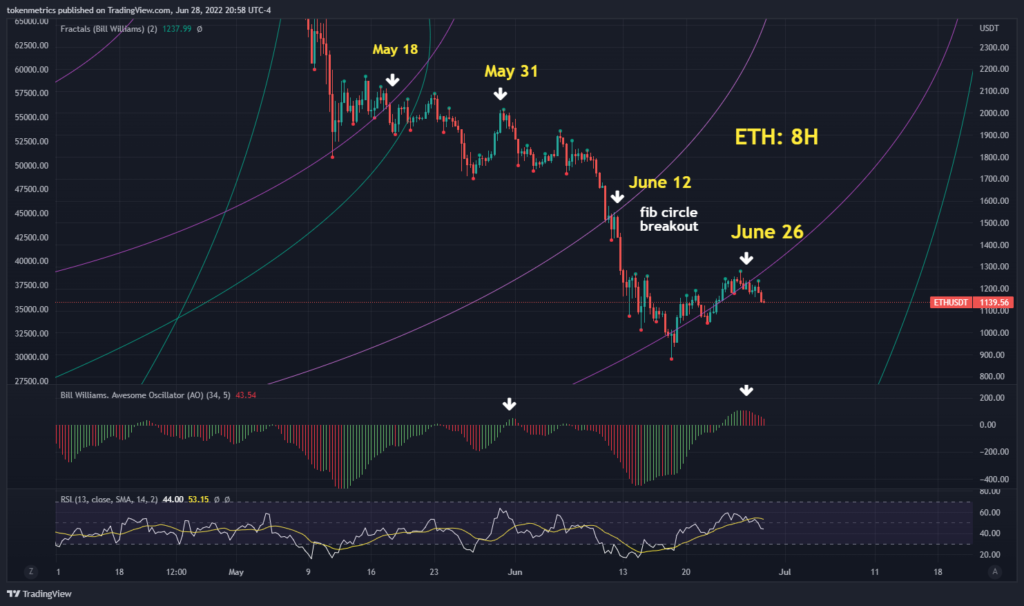
Ethereum 8H Chart

Past performance not indicative of future returns
Ethereum is breaking below a Fibonacci circle structure near $1,2600. The Williams Awesome Oscillator seems to be hinting a huge move down is coming. This move could lead to a new low for the move to perhaps $770.
ETH Resistance Levels
$1390
$1,220
$1,160
Data as of 06/28/2022 | Past performance not indicative of future returns
ETH Support Levels
$1060
$960
$823
$770
$350
Data as of 06/28/2022 | Past performance not indicative of future returns
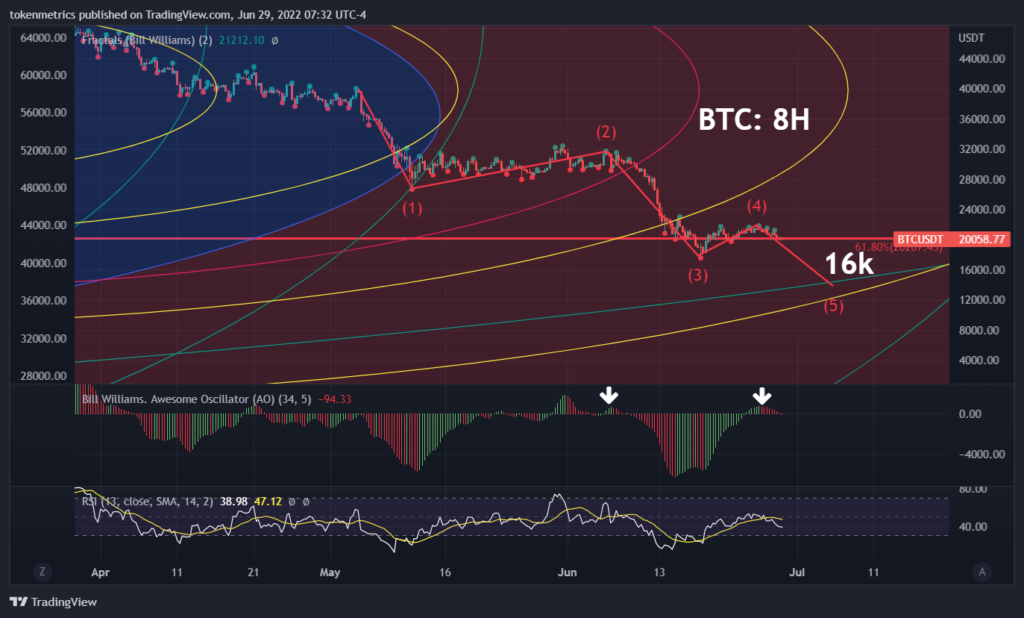
Bitcoin: 8H Chart

Past performance not indicative of future returns
If BTC is below 20k, a brutal five-wave decline could unfold. This could lead to very emotional and panic selling.
BTC Resistance Levels
$25,300
$23,000
$22,300
$21,700
Data as of 06/28/2022 | Past performance not indicative of future returns
BTC Support Levels
$19,400
$18,600
$16,700
$14,200
$11,500
Data as of 06/28/2022 | Past performance not indicative of future returns
July – October Road Map for BTC and ETH
Here’s an updated road map for ETH and BTC for the balance of 2022. There is a positive metaverse and NFT scenario for later in the year.
- Jul 3 – Jul 7: Crypto starts final leg down. BTC 16k is possible.
- July 7 – July 15: Crypto rally or stability.
- Jul 15 – July 31: Crypto decline with one big squeeze in the middle. BTC trades in a huge, volatile range.
Data as of 06/29/2022 | Past performance not indicative of future returns
Bottom Line:
Time is of the essence. The next wave of decline could be faster than the one in mid-June. Good news: The bottom could be at the end of October or the end of October. Start making a shopping list of NFTs and metaverse watchlists. We will be looking at NFTs that are more like real art.


