How to make profits using the visual trends indicators.
04 How To Utilize Trends Indicator – YouTube
The Token Metrics Visual Trends Indicator is one of the most valuable features on our site.
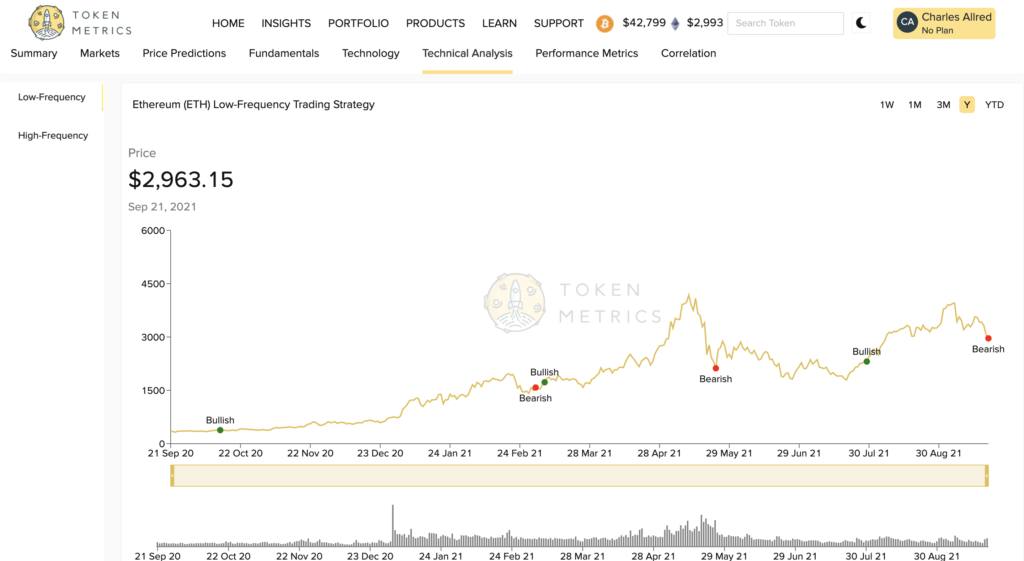
This product uses multiple technical indicators in combination with our machine learning models to produce bullish or bearish signals on thousands of different assets.
The indicators work on any asset with more than 90 days of trading data.

The visual trends indicators work for a low-frequency strategy and high-frequency strategy.
The bullish and bearish signals can be interpreted as buy and sell signals (bullish being the buy signal, bearish being the sell).
The low-frequency strategy shown above is designed for long-term HODLers and value investors, and it’s meant to trade less frequently than the high-frequency strategy.
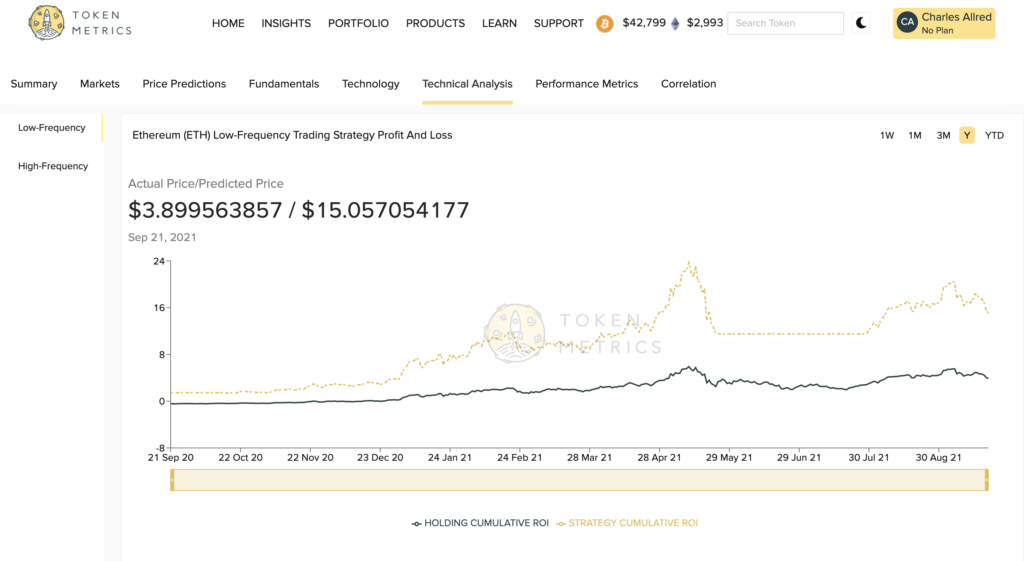
To view the profitability of these strategies, select “View PL Chart” under the trading strategy chart.

The profit and loss chart shows us the outcome of our strategy compared to just buying and holding the coin for the time period selected.
A flat line means there was a bearish signal, and the AI sold out of its position, meaning it is currently experiencing no profit or loss.
The visual trends indicators have proven to be a very useful tool for our customers and even saved significant amounts of money in the correction of May and June 2021 for those who were following them.
For more information on how to use the visual trends indicators, please refer to this video from our Senior Quantitative Analyst and co-creator of the visual trends indicators, Jad Hajali.


