How to Read the Onchain Analytics
The Onchain Analytics analyze the 3 pillars of crypto: Bitcoin, Ethereum, and Stablecoins
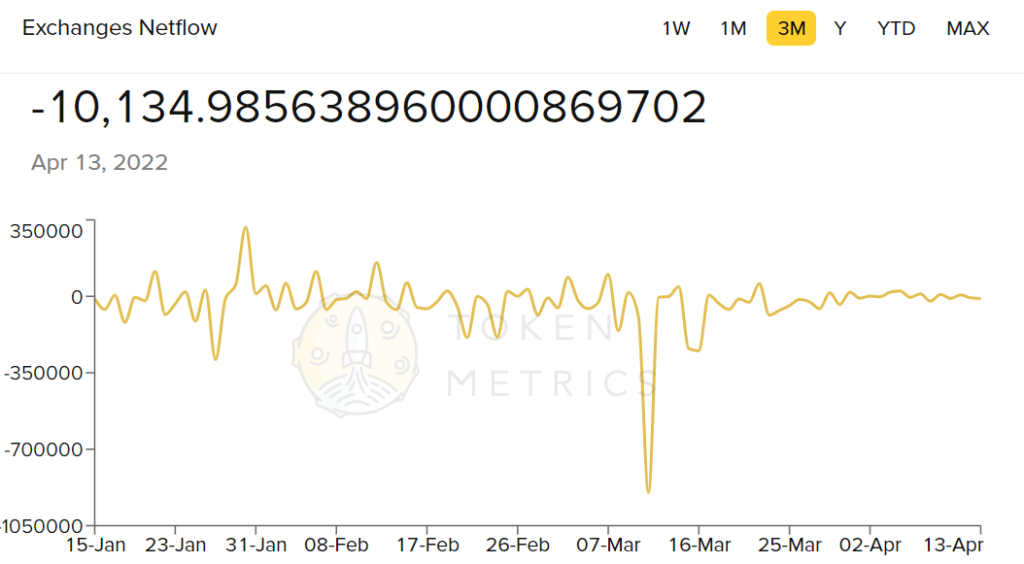
The Exchanges Netflow reveals the amount of tokens either sent to exchanges or being removed. A positive value shows a gain in assets for the exchanges, while a negative value shows a loss for the exchanges. Whenever we see a negative flow of Bitcoin and/or Ethereum, it signifies that investors are transferring to their personal wallets or external accounts, which shows reduced sell pressure and anticipation of price appreciation/utility.
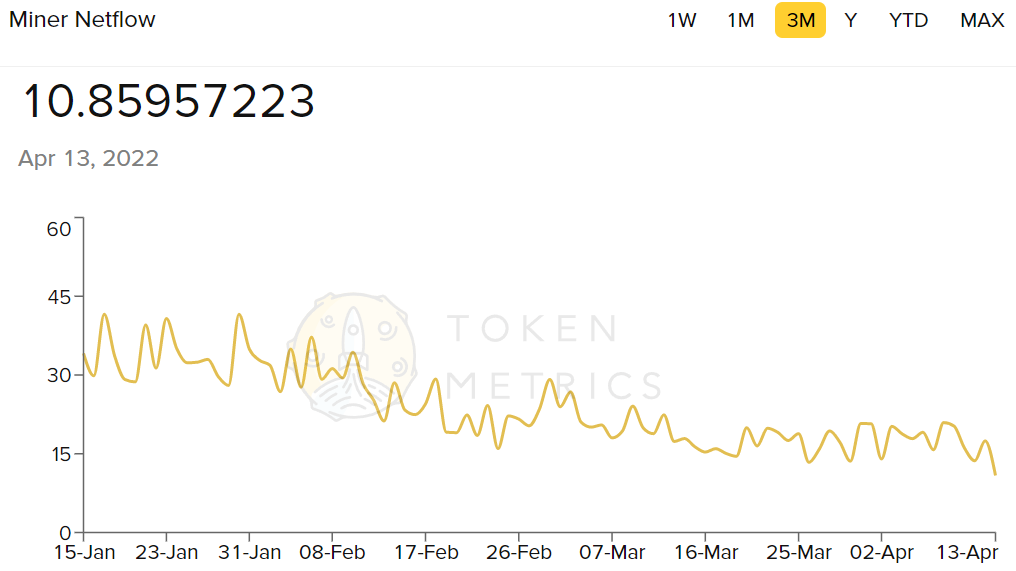
The Miner Netflow is applicable only for Bitcoin. Whenever there are big drops in the market, it is important to check this section to see if the dump came from miners, which could be indicative of the end of a bull run.
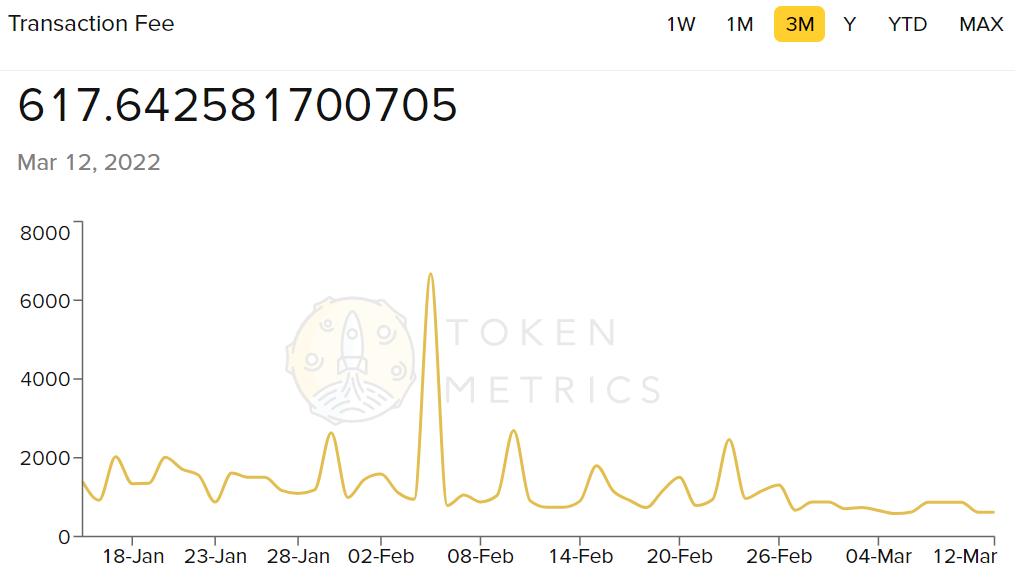
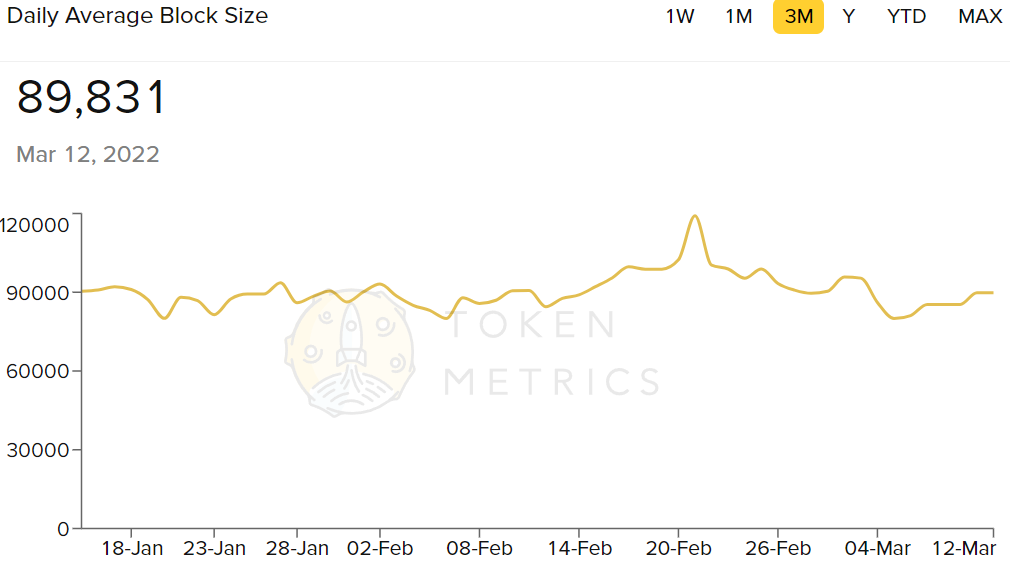
Transaction Fee and Daily Average Block Size are applicable only for Ethereum. They reveal the amount of activity occurring on the blockchain, however Transaction fees should slightly decrease once ETH 2.0 is launched. Ethereum’s block size is larger because of a campaign to increase the gas limit – which essentially changes how many transactions can fit in a block – by miners and developers who wanted to process more transactions on-chain given historic demand.
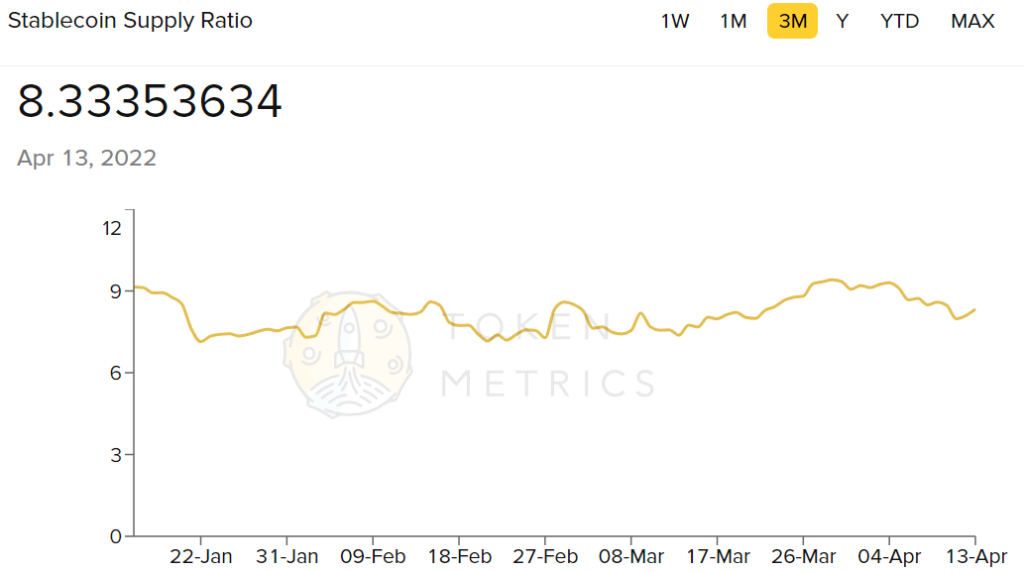
Stablecoin Supply Ratio indicates whether the market is taking a more defensive approach, as an increase would signal a preservation of wealth and low confidence in asset appreciation.


